Sports analytics · Full-stack
Hoops Stock Market
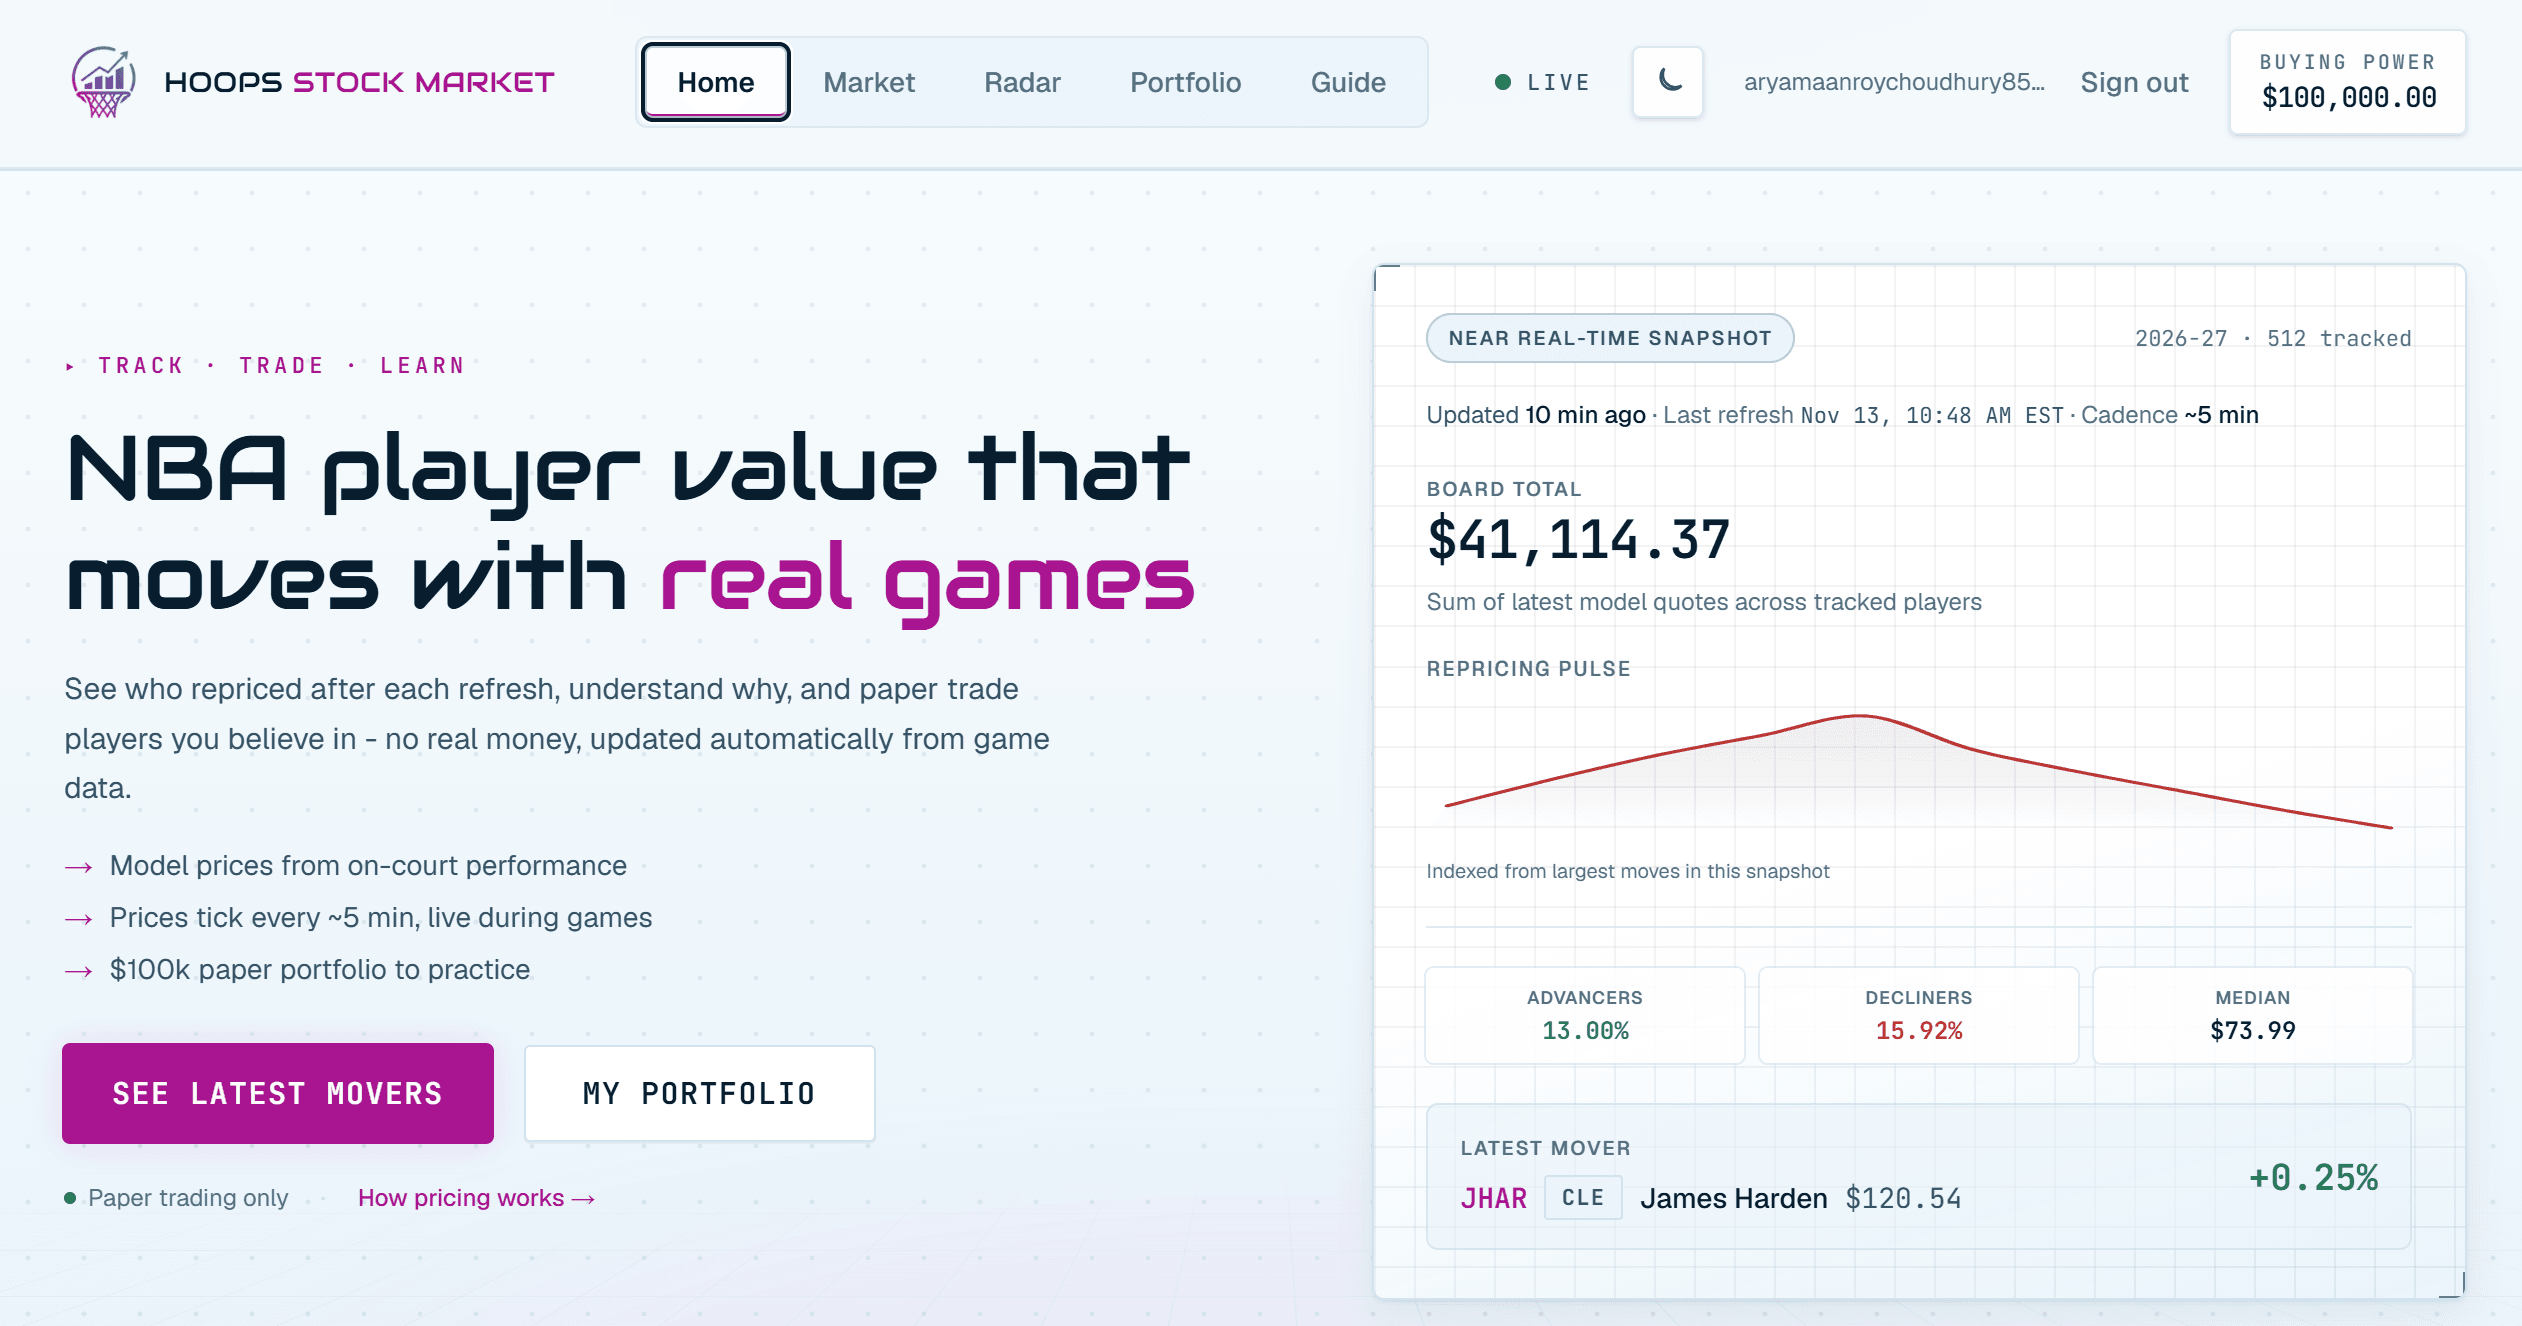
Every NBA player has a stock price. A Python pipeline turns game data into player values, and a Next.js site lets you browse the market, see why a price moved, and paper-trade with simulated money.
- Role
- Solo developer
- Timeline
- Sep 2024 – Present
- Stack
- Python
- Next.js
- TypeScript
- Supabase
- PostgreSQL
- React
Slide 1 of 3
The problem
A box score tells you what happened in one game, but not how much that game should change a player’s value. I wanted a way to track player value over a season, see why it went up or down, and make paper trades to back up an opinion about a player.
01Data ingestion & ETL
A Python pipeline ingests NBA game data, normalizes it, and writes player-level records to a Supabase (PostgreSQL) backend. The pipeline has processed more than 91,000 NBA games, and the board refreshes on an ingestion cycle of roughly 30 minutes when new regular-season or playoff games arrive.
02Two-layer pricing model
- Fair Value is the slow, performance-driven layer that moves with on-court production across recent games.
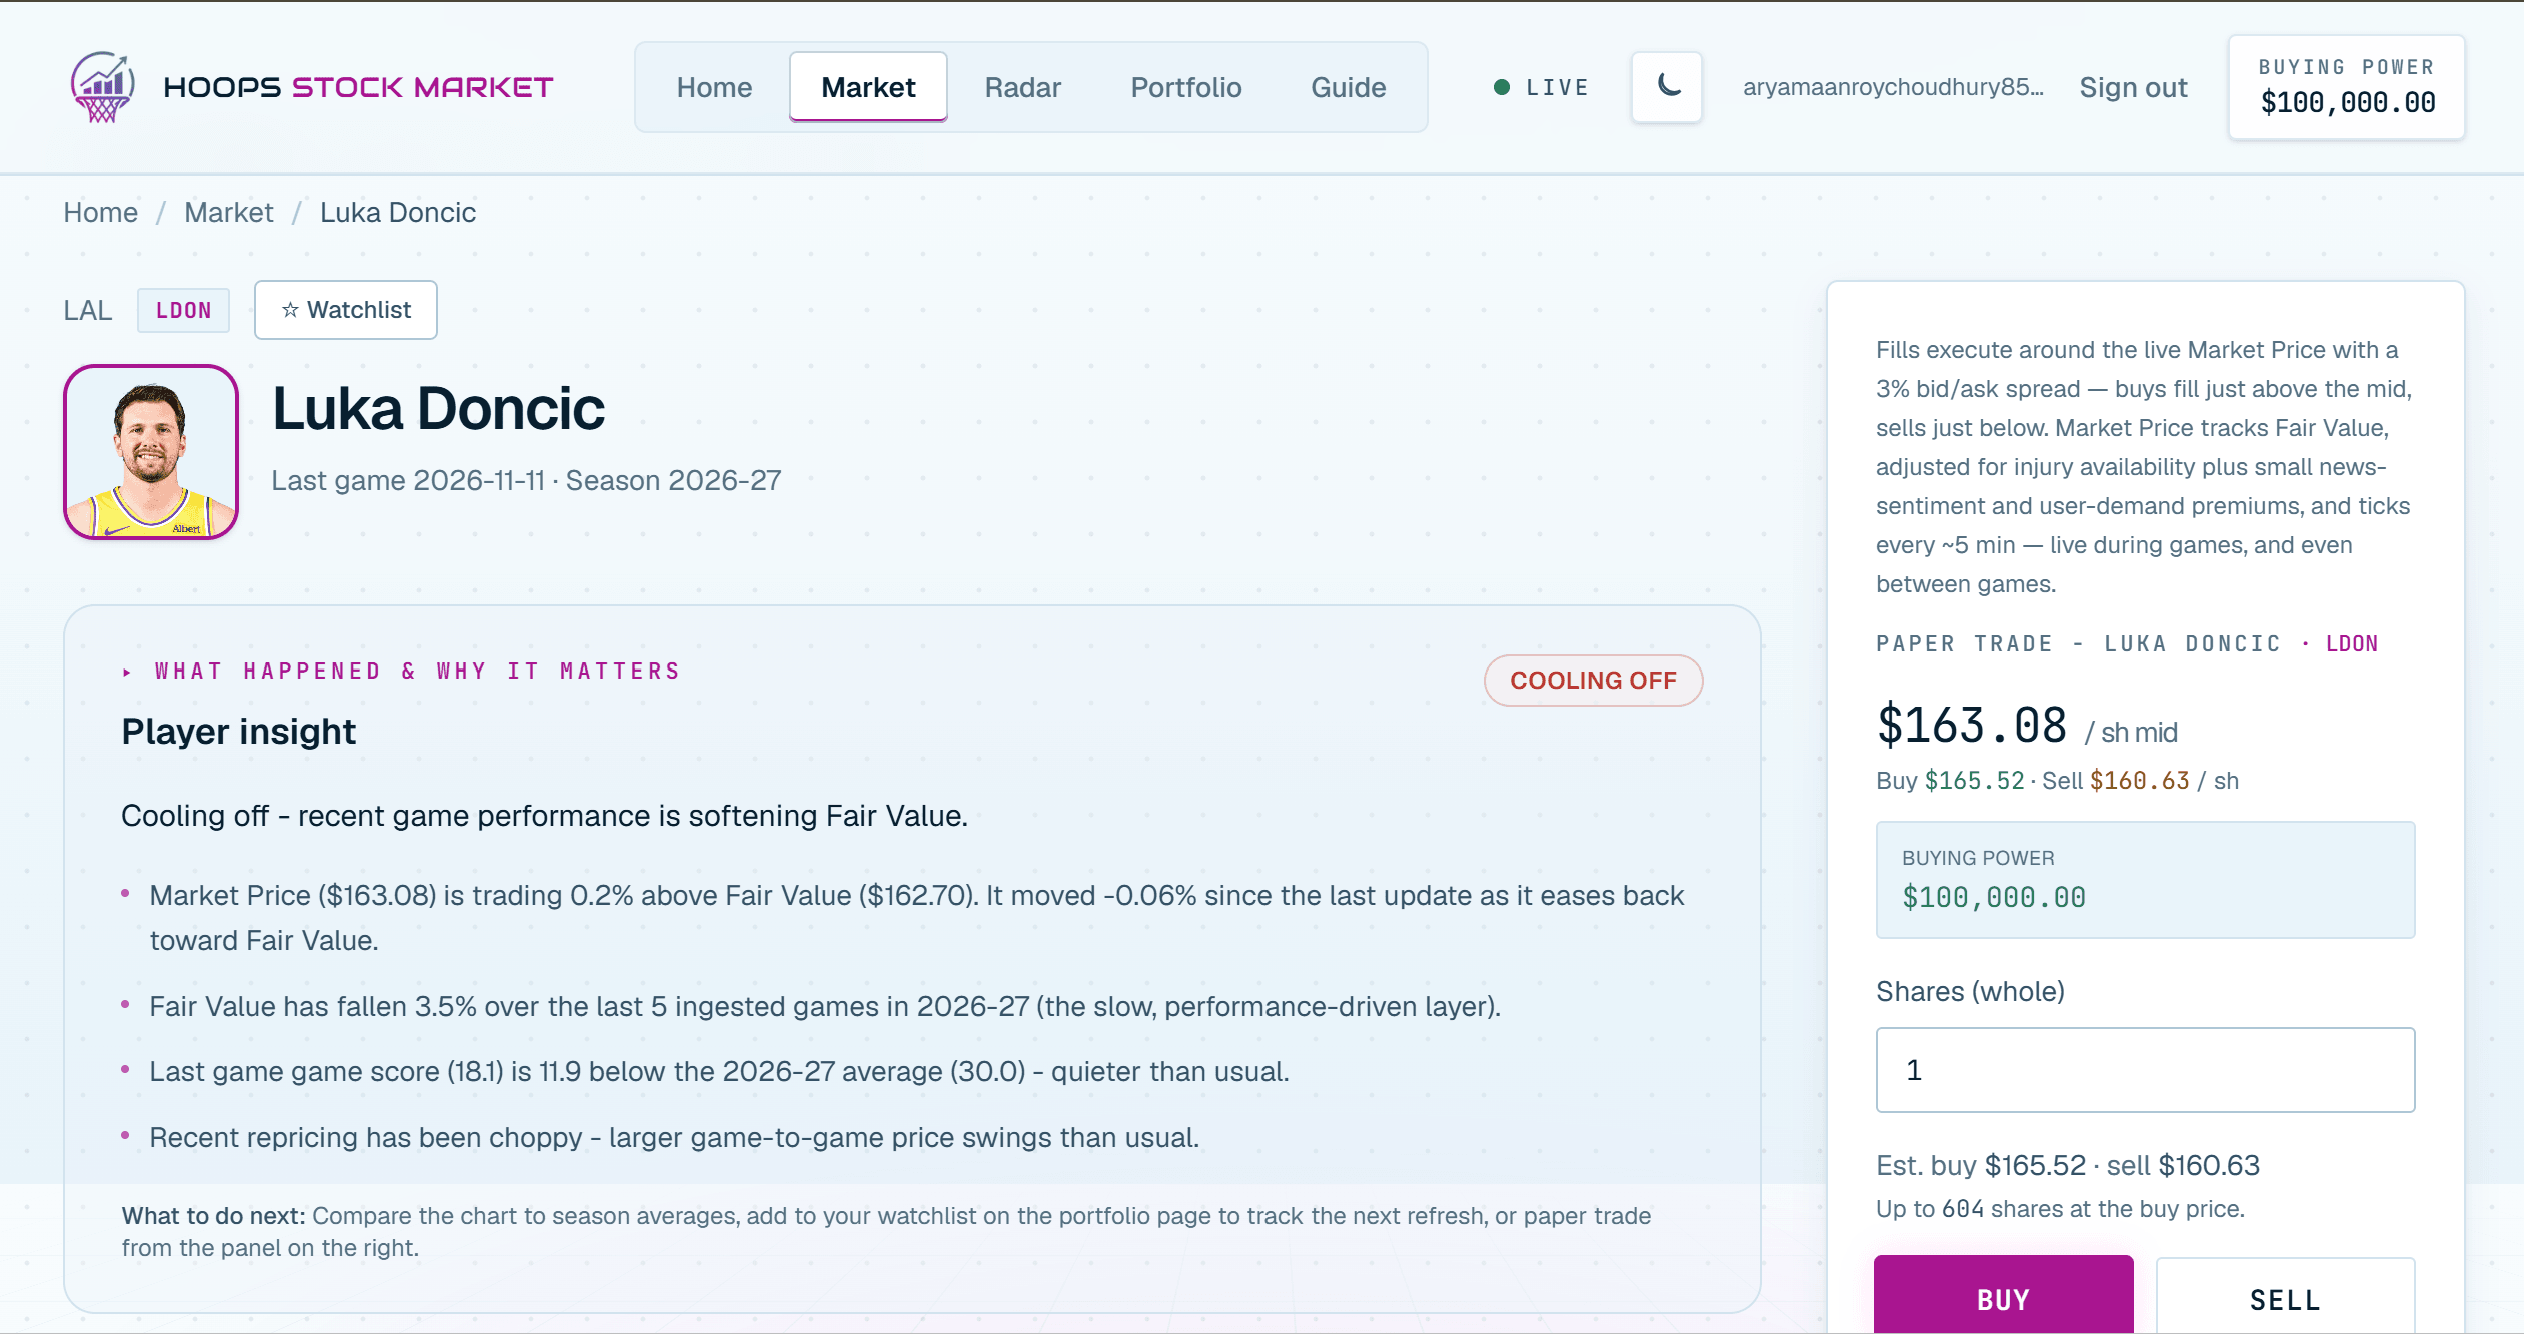
- Market Price tracks Fair Value plus explainable premiums for projection, demand, sentiment, and team context, and reprices every ingestion cycle, even between games.
- Each player page shows whether the market is trading at a premium or discount to Fair Value, so price and value can be compared directly.
03Trading & portfolios
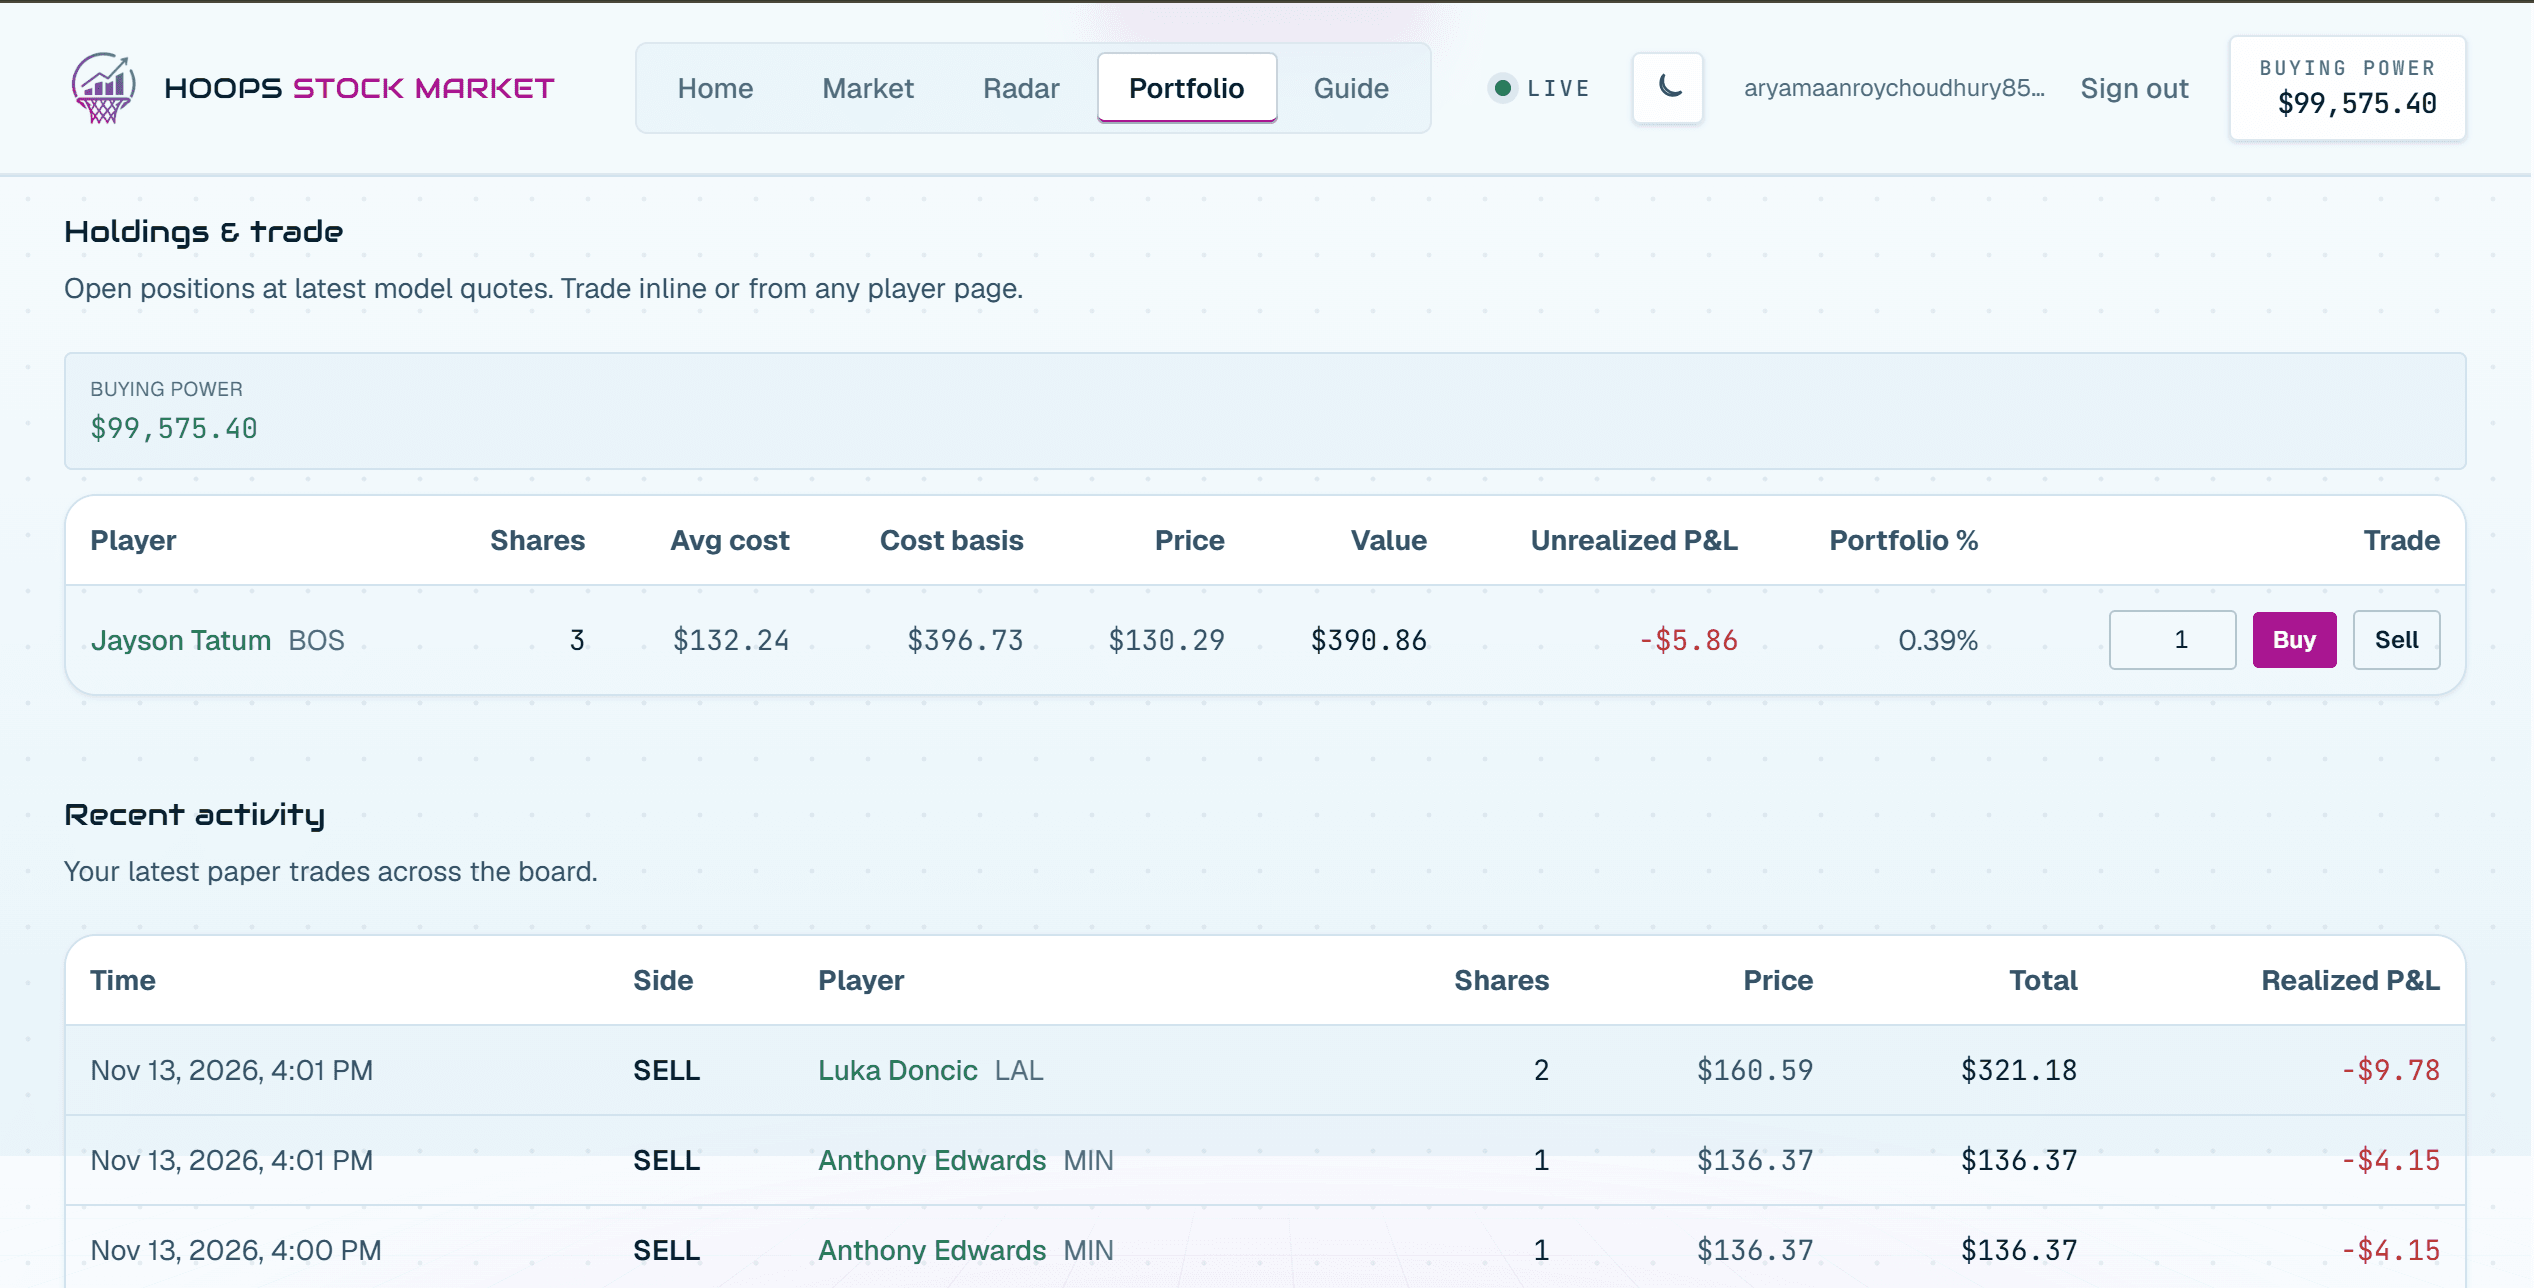
- Users start with $100,000 in simulated buying power and trade whole shares.
- Fills execute around the live Market Price with a 3% bid/ask spread: buys fill just above the mid and sells just below it.
- Authentication and per-user portfolios and watchlists are backed by Supabase.
04Pages
- The market board lets you search and sort 500+ players by price, outlook, market cycle, and last-game movement.
- Each player page has a price chart and a short written explanation of what happened and why the price moved.
- There are also Radar, Portfolio, and Guide pages.